Spinning Top
The spinning top indicates indecision about the future price movement. This is because the buyers and sellers both push the prices on their sides. It helps to gain information about the present situation of the market. This information helps traders to take a position in the present market.
In This Article
What is Spinning Top?
How to analyse a chart using Spinning Top?
Category – Trend
Type – Leading
What is Spinning Top?
The spinning top candlestick chart pattern is a formation that takes place when buyers and sellers balance out each other which leads to similar opening and closing levels. This candlestick pattern is known as a continuation pattern because of the small change it makes in the market direction.
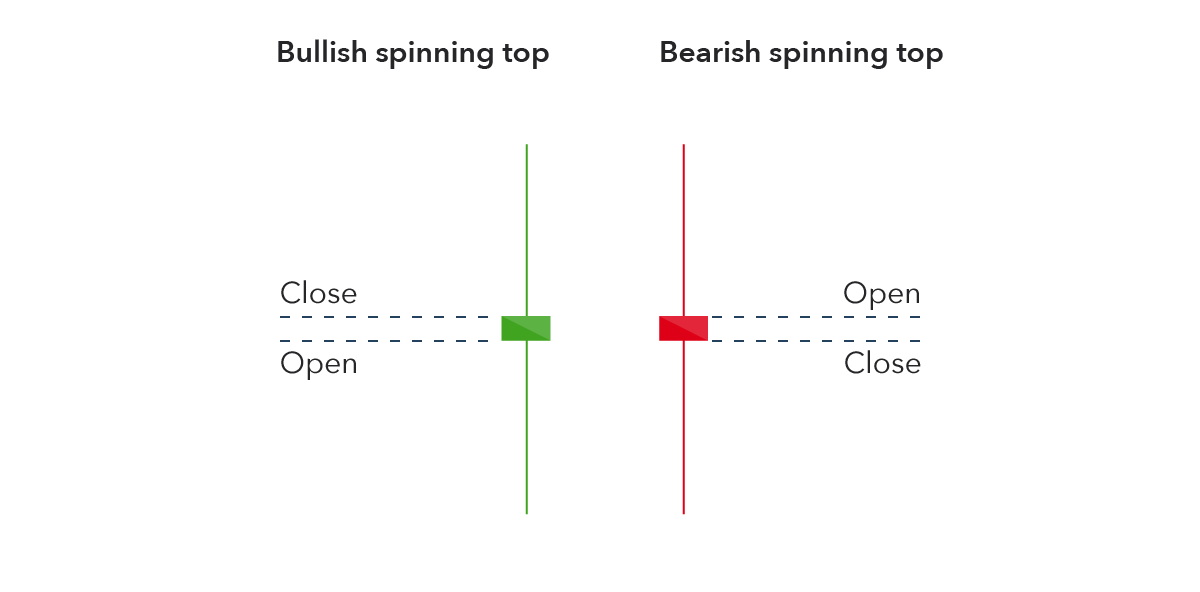
This chart pattern consists of two variations i.e bullish spinning top which is green in color and a bearish spinning top which is red in color. The bullish formation takes place when the closing price is higher than the opening price. At the same time, the bearish formation takes place when the opening price is higher than the closing price.

Image Source:- https://a.c-dn.net/c/content/dam/publicsites/igcom/uk/images/content-2-chart-images/spinning_top.png
How to analyse a chart using Spinning Top?
The trading through the spinning top pattern is quite similar to other candlestick formations. Let’s understand this by following two examples:-
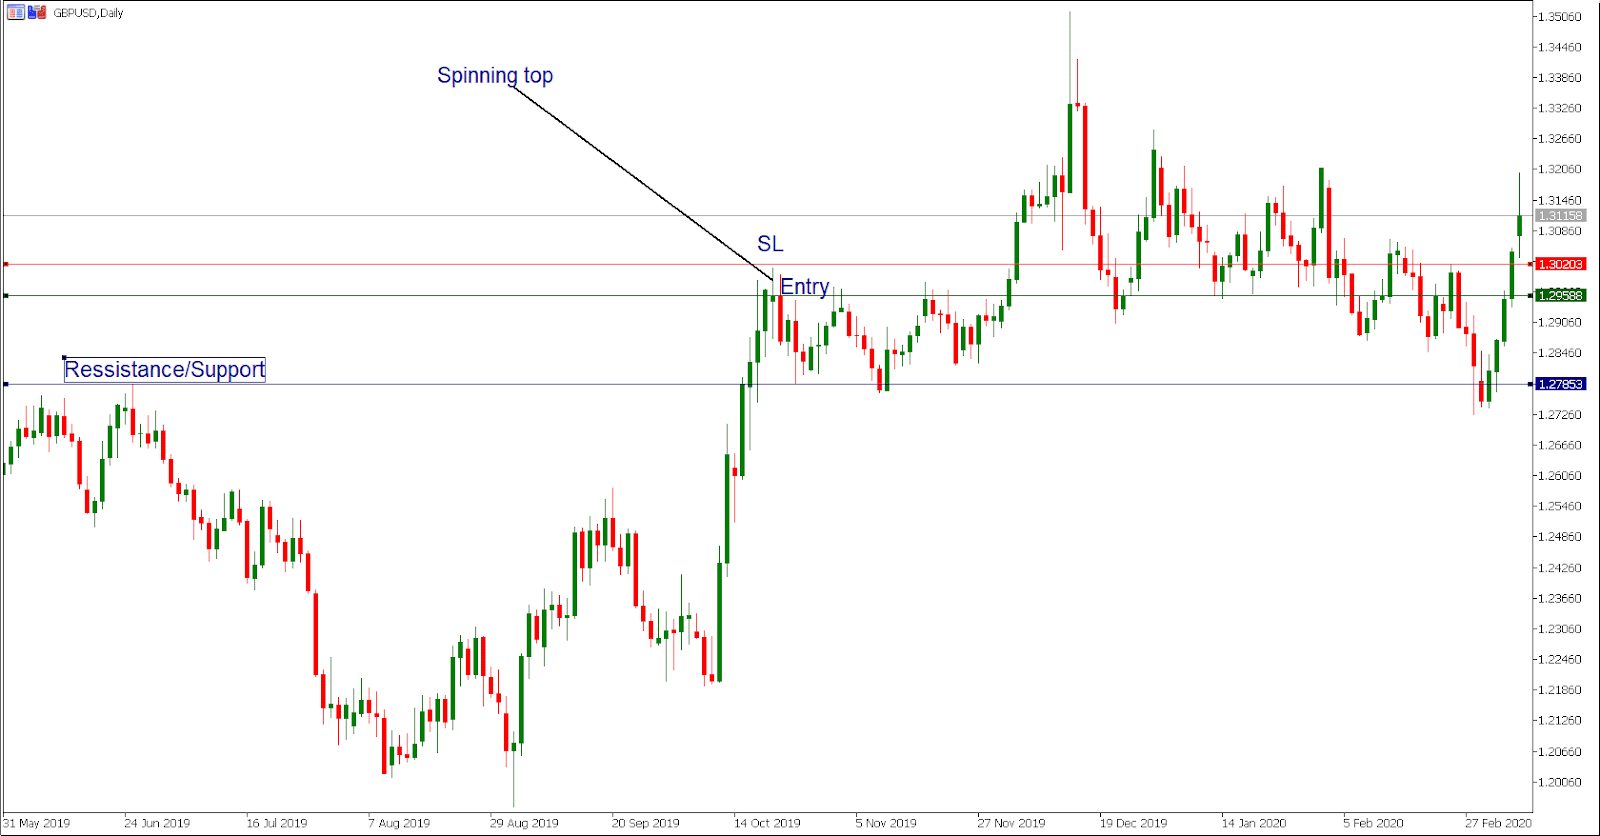
Below is given GBP/USD daily chart:-

Image Source:- https://www.thinkmarkets.com/getmedia/07d7f070-550a-4f46-bfd8-713a4e59f2b7/spinning_pattern_3.png.aspx
The price action here moves high and creates a new short-term high. But bulls are unable to force a high close so the price gets closed near the opening price.
The spinning top pattern indicates the end of a strong upside move. At this point, you can either wait for the confirmation candle or try to open a trade immediately after the spinning top formation is created. The stop loss shall be placed above the previous high.
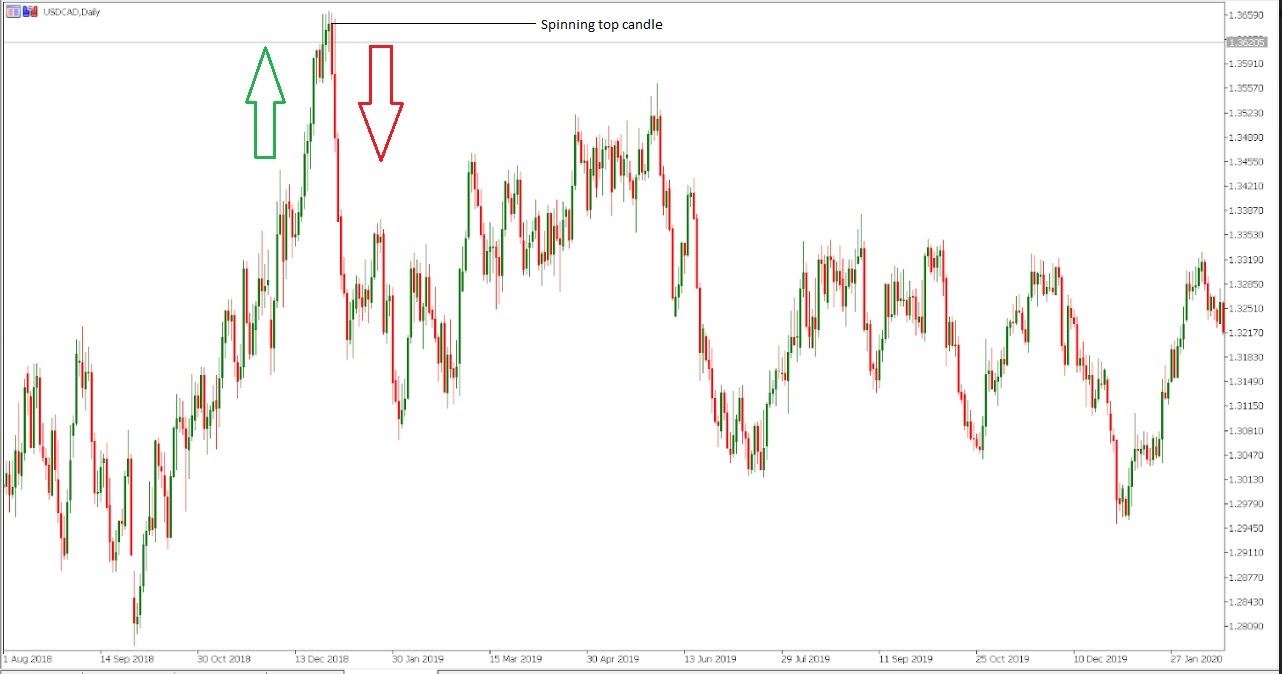
You can observe a similar situation in the USA/CAD daily chart below:-

Image Source:- https://www.thinkmarkets.com/getmedia/6f10cab5-1784-4ddb-985a-ba5554b7d2ca/spinning_pattern_4.jpg.aspx
An impulsive bullish move is observed before the consolidation takes place at the end of an uptrend which includes a spinning top candle that has a top which is a marginally new high.
The investors realize that bulls are losing momentum. This is because of the hesitation at the top to move forward in the same direction. Due to this, a sharp move starts towards the downside and as a result, the bulls lose their entire gains.
Either you can open the trade immediately after the formation of the spinning top pattern. Or you can wait for the next candle and receive further confirmation of an impending reversal.
Related Articles
How do I change my password?
Sign In to keev.tech after Sign in, Click on the Profile Picture (account settings) icon at top right of the dashboard page Click on “Profile” and now you can change your password.Vortex Indicator
It is a technical indicator for identifying new or existing trends in the market. Introduced by Swiss market technicians Etienne Botes and Douglas Siepman, the Vortex indicator uses historical price data to predict trends in stock and commodity ...Abandoned Baby
The abandoned baby pattern is a multiple candlestick reversal pattern. A bullish abandoned baby pattern indicates the end of the selling pressure of the bears and the return of bulls in the market. Whereas a bearish abandoned baby is the sign that ...Full Stochastic
Full Stochastic is a technical indicator that predicts the overbought or oversold situations in the market. Traders and investors use this indicator to figure out the buy or sell signals. By using KEEV, you can analyse the Full Stochastic indicator ...#GetSmartWithKEEV Newsletter Vol 2: Insights on Index for the upcoming week
"The best time to buy is when there's blood in the streets." - Baron Rothschild Index Insights: KEEV Key highlights of the week: The markets after a consolidation phase is seeing a strong bull run. Equity mutual funds' inflow drops 76% to Rs 2,258 ...