Inside Bar
An Inside bar is a simple and powerful candlestick pattern. You may not find an Inside Bar pattern so easily. This is because this particular strategy requires a trend that is strong and not exhausted. Finding an Inside Bar set up in the trending market can be a tough task.
In This Article –
· What is Inside Bar?
· How to analyse chart using Inside Bar?
· How to use Inside Bar on keev?
Category Volatility
Type Lagging
What is Inside Bar?
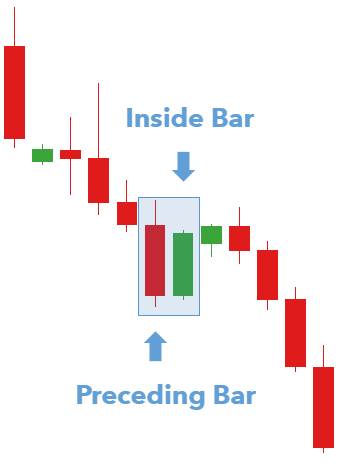
The Inside bar is inside of a large candle. The large candle is also called a mother candle. An inside bar candle pattern forms after the market shows a long move and represents the period of consolidation. Inside bar is a very powerful price pattern if you can understand to trade with it properly. The range of the Inside Bar candle can't be outside the mother candle even by 1 point. The Inside Bar is also known as a breakout or reversal pattern. The Inside Bar pattern is always in the shadow of the preceding bar. It’s a two-candlestick formation.
How to analyse chart using Inside Bar?
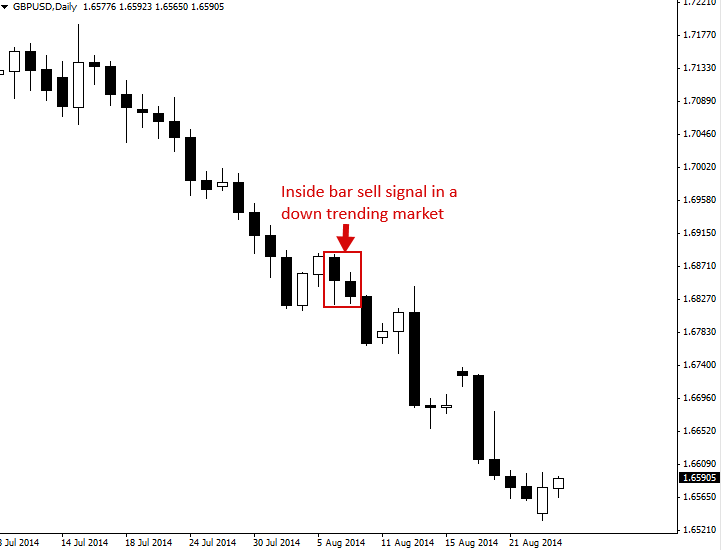
Inside Bars can be traded in trending markets and that too in the direction of the trend. This is referred to as the Inside Bar price action break-out pattern. In the example below it was a down-trending market so the inside bar pattern would be called as ‘inside bar sell signal’.
Inside Bars can also be traded against the trend, from Key Chart levels. This is referred to as Inside Bar Reversals. In the below example we can see that the Inside Bar pattern is against the dominant daily chart trend. Here the price has come back down to test a key support level, forming a pin bar reversal at that support, followed by Inside Bar Reversal.

The perfect entry of Inside Bar is to place a buy stop or sell stop at the high or low of the mother bar. When the price breaks out above or below the mother bar, the entry order is filled.
Related Articles
Williams Alligator
The legendary trader Bill Williams developed the Williams Alligator indicator three decades ago in 1995. The indicator is quite popular among traders. The Williams Alligator indicator helps to discover the absence of a trend, a trend that is ...Moving Average RSI
What is the Moving Average Relative Strength Index? Moving Average Relative Strength indicator is also defined as the MARSI indicator or Moving Average RSI. This indicator can get a nice smooth RSI line by returning the RSI of a moving average. This ...Side 3 Gaps
Side 3 Gaps is a candlestick chart pattern which helps traders in determining trend reversal before it happens. The three gaps must always be independent and shall represent a clear current trend which is either going up or going down. It signals ...Simple Moving Average (SMA)
A simple moving average is a technical indicator that aids in determining if an asset will continue its ongoing trend. Both short-term and long-term investors use the simple moving average as it’s customisable over various time horizons. Most ...Candlestick Chart With Example
Traders use candlestick charts to predict potential price movement based on historical trends. When trading, candlesticks are helpful since they display four price points (open, close, high, and low) over the specified time period. The same price ...