Simple Moving Average (SMA)
A simple moving average is a technical indicator that aids in determining if an asset will continue its ongoing trend. Both short-term and long-term investors use the simple moving average as it’s customisable over various time horizons. Most investors use SMAs to determine trend direction and discover trading signals.
Category
Trend
Type
Lagging
In This Article
What is Simple Moving Average?
How To Analyse Chart Using Simple Moving Average
What is Simple Moving Average?
SMA is one of the oldest and most widely used technical indicators. It refers to a stock’s average closing price over a specified time period. As the prices of stocks change consistently, this average is referred to as moving.
As a technical indicator, SMA aids in determining if an asset price will continue or if it’ll reverse an ongoing (bull or bear) trend. Traders use this technical chart indicator for determining buy and sell signals for securities. In addition, SMAs help to identify the support and resistance zones.
In order to calculate the simple moving average of a stock, divide its sum of closing prices by the number of periods in that range.
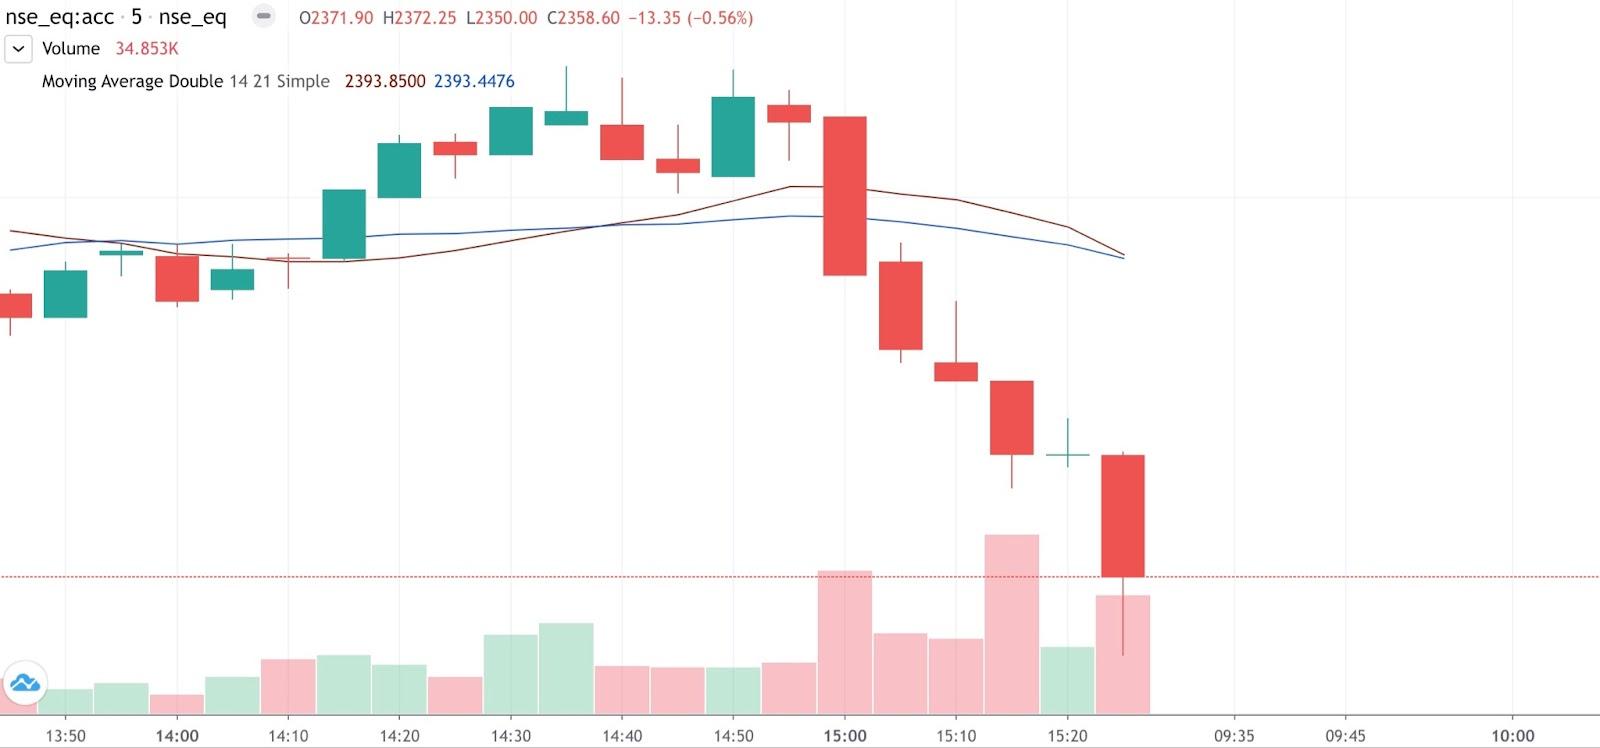
How To Analyse Chart Using Simple Moving Average
Most traders use a 200-bar SMA to gauge the long-term trend and a 50-bar SMA for an intermediate trend.
If the simple moving average advances upwards, the trend is up. Conversely, if it’s moving downwards, the trend is down.

In order to trigger trading signals, price crossing SMA gets used. Here’s how investors can make the most of it.
Cover short or go long when the prices cross the SMA.
Exit long or go short when the prices cross below the SMA.
SMA crossing SMA is another regular trading signal. Here’s how investors can benefit from it.
When the short-term SMA crosses below the long-term SMA, go short or sell.
Related Articles
Moving Average (MA)
A moving average is a stock indicator that traders use to identify a stock’s trend direction. Besides that, it also helps determine the resistance and support levels of financial security. A declining MA indicates a downtrend. Conversely, a rising MA ...Exponential Moving Average (EMA)
EMA is a technical chart indicator that tracks the price of a financial instrument over time. Investors use it to determine trend direction, support areas, and resistance regions. Like other MAs, the Exponential Moving Average doesn’t help predict ...Volume Moving Average
What is Volume Moving Average (VMA)? Volume Moving Average is very similar to a simple moving average. But it is determined using volume data rather than price data. Volume moving averages help you to understand the general trends and volume patterns ...Triangular Moving Average
The Triangular Moving Average is a technical indicator similar to other moving averages. It is a simple MA that has been averaged again, creating an extra smooth moving average line. This indicator shows the average price of an asset over a specified ...Weighted Moving Average
Weighted Moving Average (WMA) is one of the most popular indicators. This is due to the simple formula and its ability to measure market momentum. Weighted Moving Average is more descriptive and ultimately more detailed and follows the price more ...