Advance Block
The advance block candlestick pattern is a very familiar pattern these days. But it was a very unusual pattern before the emergence of algorithm trading. This chart pattern reflects how the market is in an uptrend or a pullback within a downtrend. It describes temporary uptrends and drawbacks within downtrends.
In This Article –
What is Advance Block?
How to analyse the chart using Advance Block?
How to use Advance Block on Keev?
Category – Trend
Type – Leading
What is Advance Block?
The advance block is a candlestick pattern which indicates a bearish reversal signal. It can be seen on candlestick charts. It’s a three-candle bearish reversal pattern. Here the first candle is a large candlestick that is followed by two other candles that consist of small structures but high wicks. All three candlesticks are green in colour. All three candlesticks must have a shorter body than the previous candlestick. It reflects an uptrend or bullish trend. They lead to a continuation of the bullish trend. It occurs after a price increase is reflected by green candlesticks. The close of the candles must be far away from respective highs.
How to analyse chart using Advance Block?
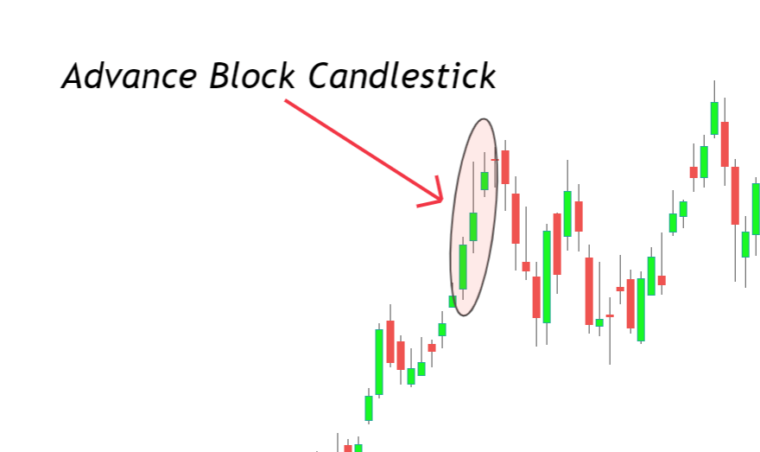
Now let's understand advance block pattern with the help of a chart.
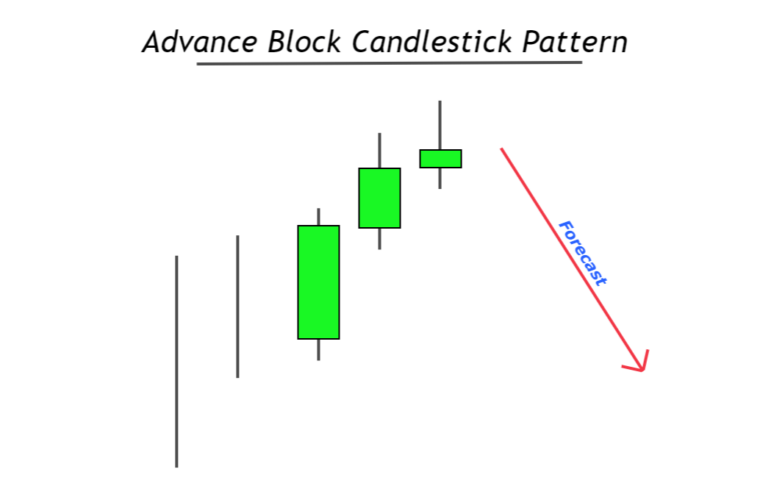
You can see that in the above candlestick pattern, the body of the candlestick decreases and at the same time the size of the wick increases with time. It is reflecting the imbalance created in the market. The price is about to turn in its direction.
An advance block candlestick pattern is used to determine the weakening of the bullish trend.
As the trend reversal is not confirmed until the price breaks the low of the first candlestick, one needs to hold on for the price to break the low of this pattern. If the price doesn’t go low then it will be a false pattern. The advance block pattern provides a meagre risk-reward ratio. This is the reason why you shall use a bit for technical analysis to confirm trend reversal and trade on a lower time frame which is the direction of the bearish trend.
Related Articles
How 'AND' or 'OR' Logic Connector work?
‘AND’ or ‘OR’ Logic connectors can be used when user wants to combine more than one indicators to form a single entry/exit strategy. You can connect more than one indicator with the help of an ‘AND’ or ‘OR’ connectors. There are 2 kinds of logic ...Ultimate Oscillator
It is a technical analysis indicator that measures the price momentum of an asset across multiple timeframes. This indicator, developed by Larry Williams in 1976, represents short, medium, and long-term trends. The multi-timeframe objective of this ...What is Technical Analysis ?
Since its inception, traders, analysts, and investors have utilized technical analysis. It has gained widespread support among regulators and the academic community, especially in light of its behavioral finance components. Technical analysis is a ...Simple Moving Average (SMA)
A simple moving average is a technical indicator that aids in determining if an asset will continue its ongoing trend. Both short-term and long-term investors use the simple moving average as it’s customisable over various time horizons. Most ...Benefits of Automated Trading
The benefits algorithmic trading offers over manual trading are a significant factor in its rising popularity. Algo trading has benefits in terms of speed, accuracy, and lower costs. The biggest benefit is speed because algorithms are created ...