Weighted Moving Average
Weighted Moving Average (WMA) is one of the most popular indicators. This is due to the simple formula and its ability to measure market momentum. Weighted Moving Average is more descriptive and ultimately more detailed and follows the price more closely than its corresponding Simple Moving Average.
In This Article –
What is the Weighted Moving Average?
How to analyze a chart using Weighted Moving Average?
Category – Trend
Type – Lagging
What is the Weighted Moving Average?
The Weighted Moving Average is a technical indicator that interprets trend direction. It shows how the price has moved on average over a specific time duration. It gives trade signals by assigning greater weight to recent data and less weight to past data points. The data points consist of asset close prices.
Calculation of Weighted Moving Average
Following are the given steps to calculate Weighted Moving Average.
1. Decide the numbers you want to average.
2. Determine the weights of each number.
3. Multiply each number by weighing the factor.
4. Add up the resultant values to get the weighted average.
The formula of the Weighted Moving Average is as under:-
Weighted Moving Average = [Price1 × n + Price2 × (n-1) +…..Price (n)]/ [n× (n+1)]/2
n = time period
How to analyze chart using Weighted Moving Average
All moving averages along with Weighted Moving Average are not designed to locate a trade at the exact bottom or top.
Moving averages are likely to confirm that your trade is in the general direction of the trend but with a delay at entry or exit.
Here’s how you can use the WMA in your trading:
The Weighted Moving Average indicates trend direction.
If the price is in an uptrend and is trading above a rising WMA, you can take a long position when a price goes near or just below the WMA.
If the price is in a downtrend and trading below a falling WMA, you can take a short position when the price rallies towards or a bit above the WMA.
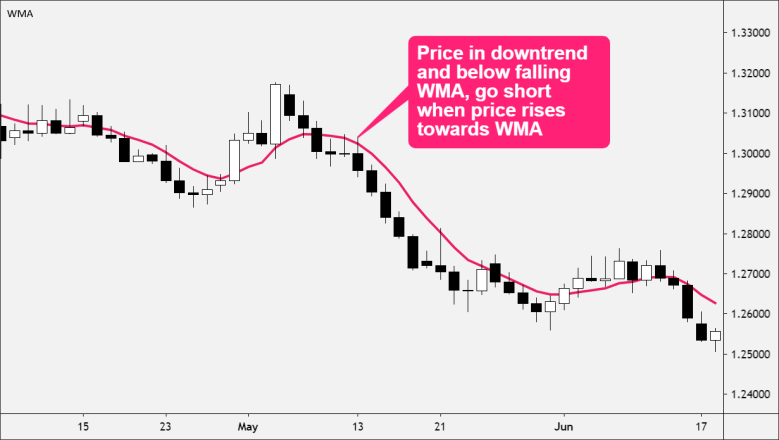
Chart 1:-
https://bpcdn.co/images/2020/05/05170956/wma-short-trade-example-780x440.png
Image Source:- https://www.babypips.com/forexpedia/weighted-moving-average-wma
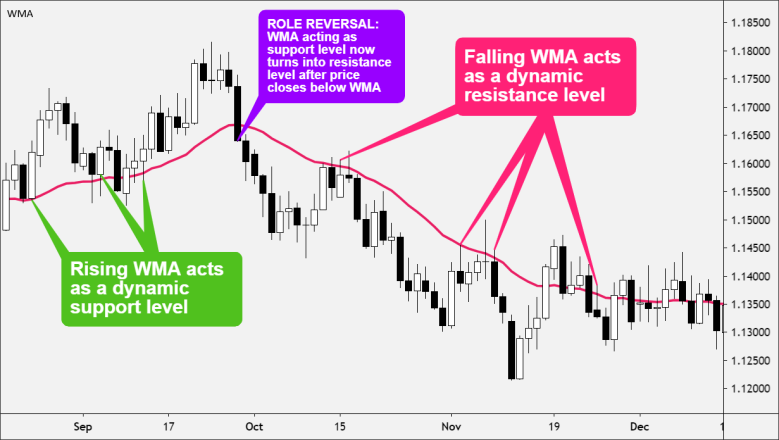
The Weighted Moving Average can indicate support and resistance areas.
A rising WMA supports the price action.
A falling WMA provide resistance support
So this indicates that you shall buy when the price is near the rising WMA or shall sell when the price is near the falling WMA.

Chart 2
https://bpcdn.co/images/2020/05/05172018/wma-as-support-and-resistance-levels-780x440.png
Image Source:- https://www.babypips.com/forexpedia/weighted-moving-average-wma
Related Articles
Volume Moving Average
What is Volume Moving Average (VMA)? Volume Moving Average is very similar to a simple moving average. But it is determined using volume data rather than price data. Volume moving averages help you to understand the general trends and volume patterns ...Triangular Moving Average
The Triangular Moving Average is a technical indicator similar to other moving averages. It is a simple MA that has been averaged again, creating an extra smooth moving average line. This indicator shows the average price of an asset over a specified ...Moving Average (MA)
A moving average is a stock indicator that traders use to identify a stock’s trend direction. Besides that, it also helps determine the resistance and support levels of financial security. A declining MA indicates a downtrend. Conversely, a rising MA ...Triple Exponential Moving Average
The Triple Exponential Moving Average was originally designed to smooth price fluctuations. Thus, it makes identifying trends easier for traders without the lag associated with traditional moving averages. Traders look at this trend indicator as a ...Simple Moving Average (SMA)
A simple moving average is a technical indicator that aids in determining if an asset will continue its ongoing trend. Both short-term and long-term investors use the simple moving average as it’s customisable over various time horizons. Most ...