Three White Soldiers
Three white soldiers have proved to be a reliable reversal pattern when applied by other technical indicators like the relative strength index. The candle size and length of the shadow are taken into consideration to determine if there is a risk of retracement. Three white soldiers being a bullish visual pattern are used as an entry and exit point by traders.
In This Article –
What are Three White Soldiers?
How to analyze the chart using Three White Soldiers?
Category – Trend
Type – Lagging
What are Three White Soldiers?
The three white soldiers pattern is a bullish candlestick pattern which is formed on the trading chart at the bottom of the downtrend. The pattern is made up of three candles that are green in color. This candlestick pattern signals an upcoming trend due to the strong buying pressure. These candlesticks do not have long shadows and open with the real body of the previous candle in the pattern.

Image Source:- https://a.c-dn.net/c/content/dam/publicsites/igcom/uk/images/content-2-chart-images/three-white-soldiers.png
If you find three consecutive green or white candlesticks then it’s a sign of three white soldiers pattern. Each of the candlesticks opens and closes progressively higher than the first one. The candlesticks should have big bodies and very small or no wicks.
How to analyze the chart using Three White Soldiers?
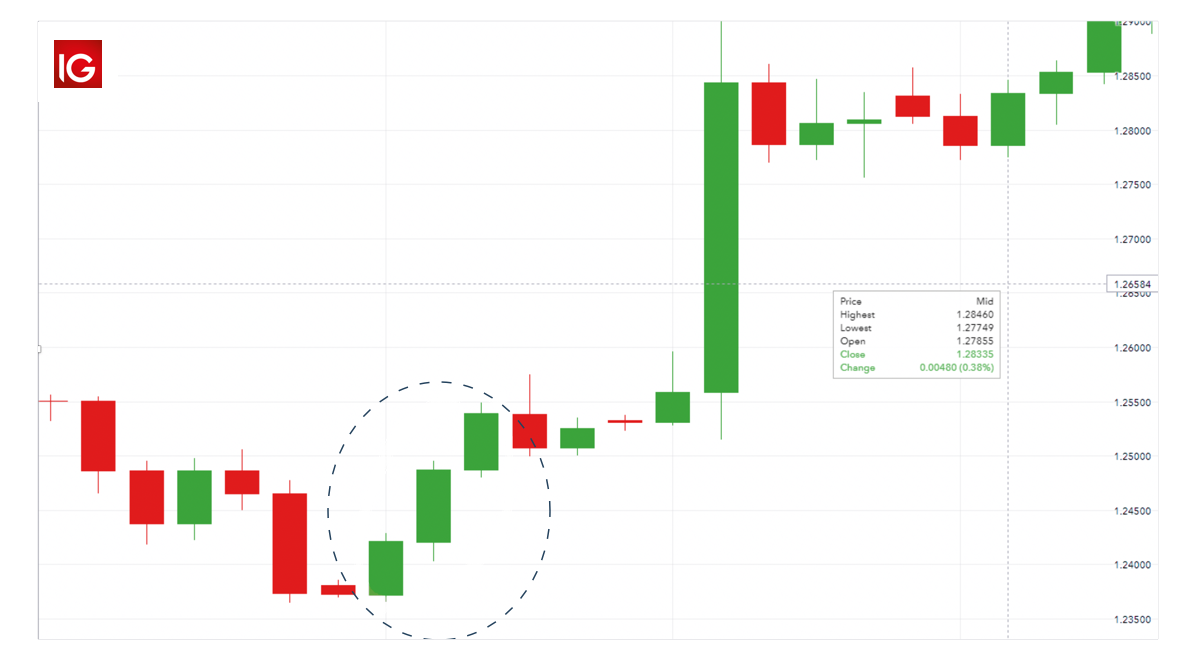
Let’s understand the Three white soldiers indicator with a chart example.
We are referring here to the GBP/USD price which opens the trading day at $1.23723. After the entry of buyers and sellers, the price starts showing movement. It goes at a low of $1.23657 but the buyers are putting a lot of pressure on the market. So the GBP/USD price hits a high of $1.24293 and finally gets closed at $1.24211.
The bulls keep on pushing the price up on the next trading day and it reaches the high of $1.24958 before closing at $1.24873. This trend is found even on the third day when buyers can push the price of GBP/USD up to $1.25494 and finally gets close to $1.25388.These upward moves over the trading period create three white soldiers candlestick patterns as shown in the below chart:-
Image Source:- https://a.c-dn.net/c/content/dam/publicsites/igcom/uk/images/content-2-chart-images/three-white-soldiers-chart.png
Some traders when they notice an upward trajectory occurring due to the three white soldiers pattern, they prefer to open a long position to gain profit.
Related Articles
Side 3 Gaps
Side 3 Gaps is a candlestick chart pattern which helps traders in determining trend reversal before it happens. The three gaps must always be independent and shall represent a clear current trend which is either going up or going down. It signals ...Evening Star
An Evening Star pattern is a candlestick pattern which appears at the end of the uptrend and it indicates that a downtrend is about to occur. As it is an indicator of a downtrend, it appears as a red flag to traders and indicates that it’s time to ...Williams Alligator
The legendary trader Bill Williams developed the Williams Alligator indicator three decades ago in 1995. The indicator is quite popular among traders. The Williams Alligator indicator helps to discover the absence of a trend, a trend that is ...Kicking Candle Pattern
A Kicking Candle Pattern is a two-bar candlestick pattern that helps traders predict a turnaround in an asset’s price change direction. It is characterized by a sharp reversal in price over the length of two candlesticks. A reversal pattern, the ...Advance Block
The advance block candlestick pattern is a very familiar pattern these days. But it was a very unusual pattern before the emergence of algorithm trading. This chart pattern reflects how the market is in an uptrend or a pullback within a downtrend. It ...