Stick Sandwich
A stick sandwich trading pattern is a candlestick formation that takes place in both bearish and bullish indications and signals a reversion of a trend. Depending on the pattern that can be bullish and bearish, it looks different. At times this pattern is considered by traders as an indication of a possible short-term trend change.
In This Article –
What is a Stick Sandwich?
How to analyze a chart using Stick Sandwich?
Category – Trend
Type – Lagging
What is a Stick Sandwich?
The stick sandwich candlestick pattern can take place in bull as well as bear markets or intraday. The pattern is made up of three candlesticks out of which one candlestick has an opposite coloured candlestick on both sides. The closing price of the two candlesticks that surround the opposite coloured candlestick must be the same.

Image Source:- https://fxpipsgainer.com/wp-content/uploads/2022/03/Bullish-and-Bearish-sandwich-candlestick-.png
In a bearish stick sandwich, you will observe that the outer candlestick will be long and green whereas the inside candlestick will be short and red and will be surrounded by outer sticks. A bullish stick sandwich looks similar but it has opposite color and trading patterns similar to a bearish sandwich.
Traders take a hint from the closing prices of the third candlestick when they need to decide whether to take a bullish or bearish position.
After the identification of this trading pattern, traders consider a bearish sandwich to run green-red-green and a bullish sandwich to run red-green-red.
How to analyze a chart using Stick Sandwich?
Let’s now understand real-life chart examples to understand how to analyze charts using a stick sandwich.
Bullish Stick Sandwich Pattern

Image Source:- https://www.tradingsim.com/hubfs/Imported_Blog_Media/Screen-Shot-2022-01-31-at-6_54_57-PM-1024x587-2.png
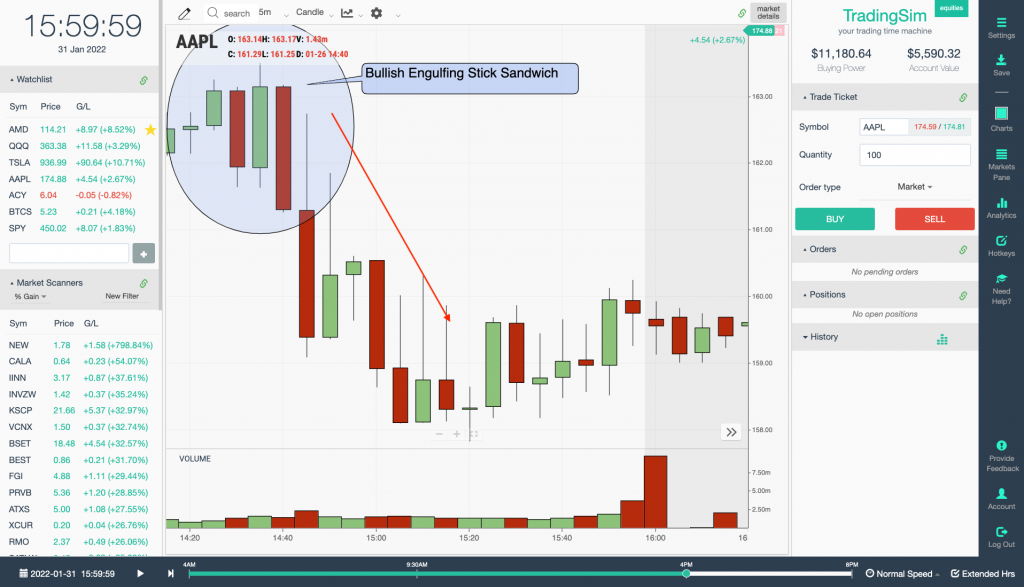
The above-mentioned is a five-minute chart of AAPL from January 2022. You can see that the blue circle consists of a bullish candlestick which is engulfed by two bearish sticks.
The first candle of the pattern represents a bearish view and closes near its low. The next candle is bullish and creates a small gap and closes above the first candle of the pattern. The third candle is bearish and engulfs the bullish candle. The third candle closes near the closing price of the first candle or lower which completes the representation of the bullish engulfing stick sandwich.
Completion of the pattern leads to a sharp price reversal to the downside over the next couple of minutes.
Bearish Stick Sandwich Pattern

Image Source:- https://www.tradingsim.com/hubfs/Imported_Blog_Media/Screen-Shot-2022-01-31-at-6_58_23-PM-1024x587-2.png
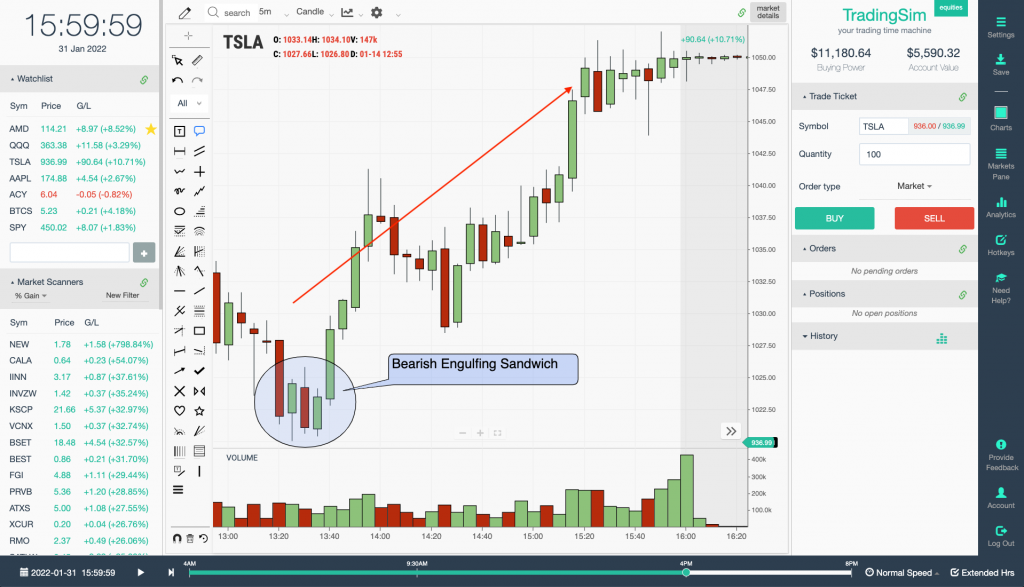
You can see above the chart of TSLA from January 2022. With the price reduction, TSLA starts forming a bearish engulfing stick sandwich candlestick pattern.
The first bullish candle closes near its high. The second candle is bearish and gaps down from the previous candle. It gets closed near the bottom of its range. The third candlestick engulfs the second candlestick and closes near the closing price of the first candle of the pattern. From the chart, it can be seen that the final candle launches the reversal.
Confirmation of pattern leads to stock moving higher at an impulsive rate.