Moving Average (MA)
A moving average is a stock indicator that traders use to identify a stock’s trend direction. Besides that, it also helps determine the resistance and support levels of financial security. A declining MA indicates a downtrend. Conversely, a rising MA shows an uptrend.
Category
Trend
Type
Lagging
In This Article
What is Moving Average?
How To Analyse Chart Using Moving Average
What is Moving Average (MA)?
MA is one of the most commonly used technical tools in stock trading. It is a stock indicator to smooth out data by generating a consistently updated average price. Traders mitigate the impacts of short-term fluctuations on a stock’s price over a time period by calculating the moving average.
While there are many moving averages in trading, here are the two foremost ones.
Simple Moving Average (SMA)
Exponential Moving Average (EMA)
The latter is preferred over the prior, as it provides more weight to recent prices. In addition, EMA shows a purer response to new trends and information.
The moving average is calculated by adding up all the previous stock prices during a specific time frame and dividing the total sum by the number of periods.
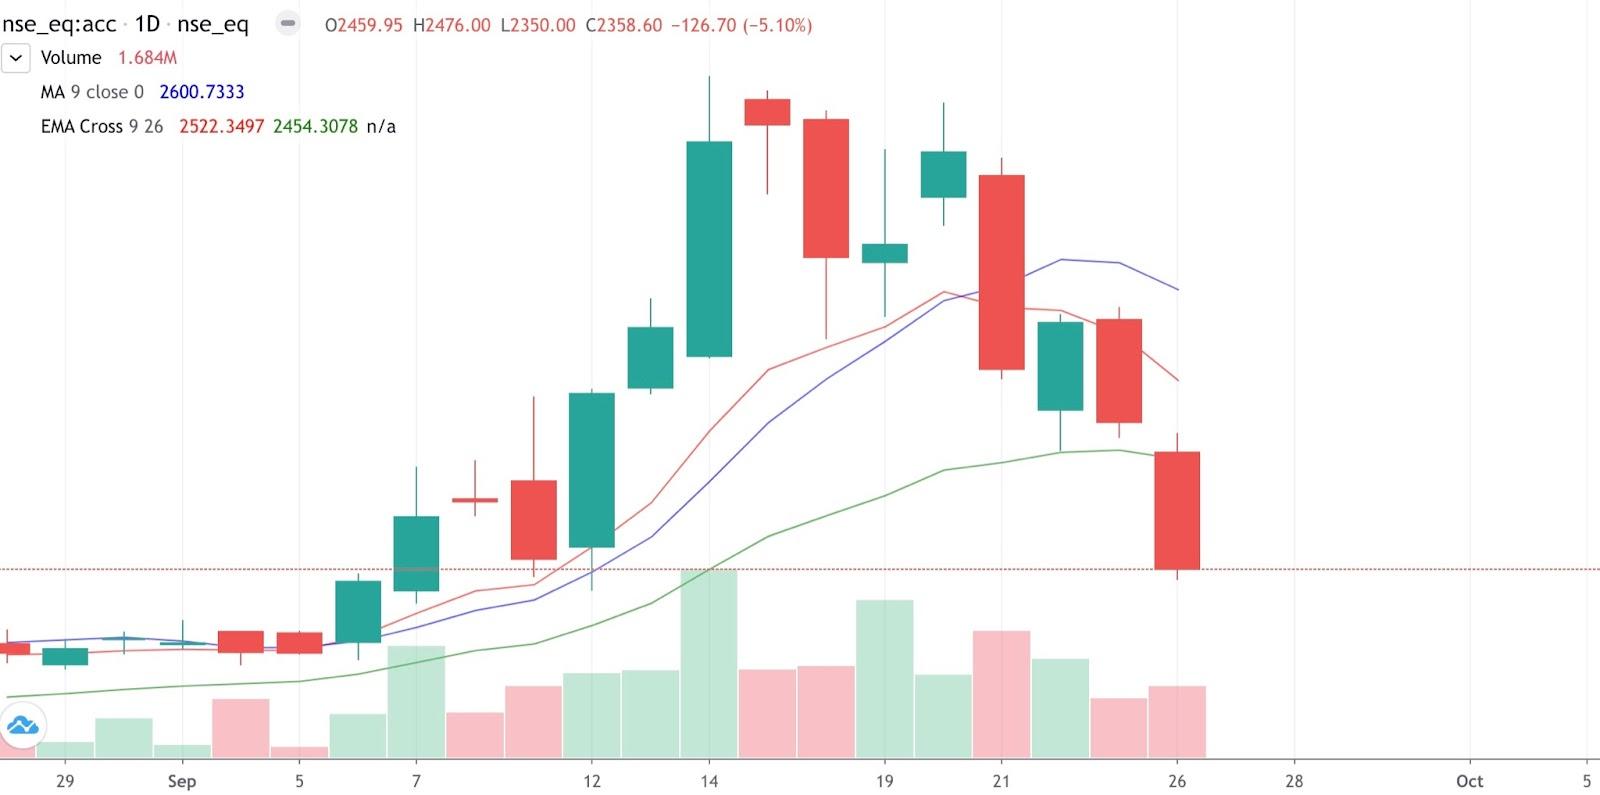
How To Analyse Chart Using Moving Average
Most traders use the 50-day and 200-day MA figures as they are vital trading signals. The longer the time for the MA, the more prominent the lag.

While a declining moving average indicates a downtrend, a rising one demonstrates an uptrend. In addition to this signal, you can use powerful crossover trading signals. These are the golden cross and the death cross.
The golden cross occurs when a shorter MA crosses above a longer MA. It is a buying signal for traders. Conversely, a death cross occurs when a shorter moving average crosses below a long moving average. It is a selling signal for traders.
For instance, if a 50-day MA crosses above a 200-day MA, it is a golden cross or buying signal. On the other hand, if a 50-day EMA crosses above a 200-day MA, it is a death cross or selling signal.
Related Articles
Triangular Moving Average
The Triangular Moving Average is a technical indicator similar to other moving averages. It is a simple MA that has been averaged again, creating an extra smooth moving average line. This indicator shows the average price of an asset over a specified ...Triple Exponential Average
It is a momentum indicator that shows traders the percentage change in the moving average that has been smoothened exponentially three times. The TRIX is a powerful indicator that helps traders to identify the overbought and oversold conditions in an ...Volume Moving Average
What is Volume Moving Average (VMA)? Volume Moving Average is very similar to a simple moving average. But it is determined using volume data rather than price data. Volume moving averages help you to understand the general trends and volume patterns ...Weighted Moving Average
Weighted Moving Average (WMA) is one of the most popular indicators. This is due to the simple formula and its ability to measure market momentum. Weighted Moving Average is more descriptive and ultimately more detailed and follows the price more ...Triple Exponential Moving Average
The Triple Exponential Moving Average was originally designed to smooth price fluctuations. Thus, it makes identifying trends easier for traders without the lag associated with traditional moving averages. Traders look at this trend indicator as a ...