Moving Average Convergence Divergence (MACD)
Moving Average Convergence Divergence is a technical indicator investors use to identify moving averages that show a new trend. It is an easy-to-use indicator that measures the relationship of the Exponential Moving Average (EMA). Traders use the positioning of the MACD line and zero line to understand a trend.
In This Article
What is MACD?
How To Analyse Chart Using MACD
How To Use MACD on KEEV
Category
Momentum/Trend
Type
Lagging
What is Moving Average Convergence Divergence (MACD)?
MACD is a trend following momentum indicator depicting the relationship between two moving averages of a financial security’s price. A trend indicated by this momentum oscillator could be either bullish or bearish. Values of MACD oscillate around a line called the central or zero line.
This indicator is one of the trouble-free tools traders use to bring profit from a fellow trader. It is calculated by subtracting the 26th period EMA from the 12th period one.
How To Analyse Chart Using Moving Average Convergence Divergence (MACD)
You can analyse a chart depicting MACD via the MACD line and Zero line as reference points. While the MACD line is the faster one, the zero line is the slower one.
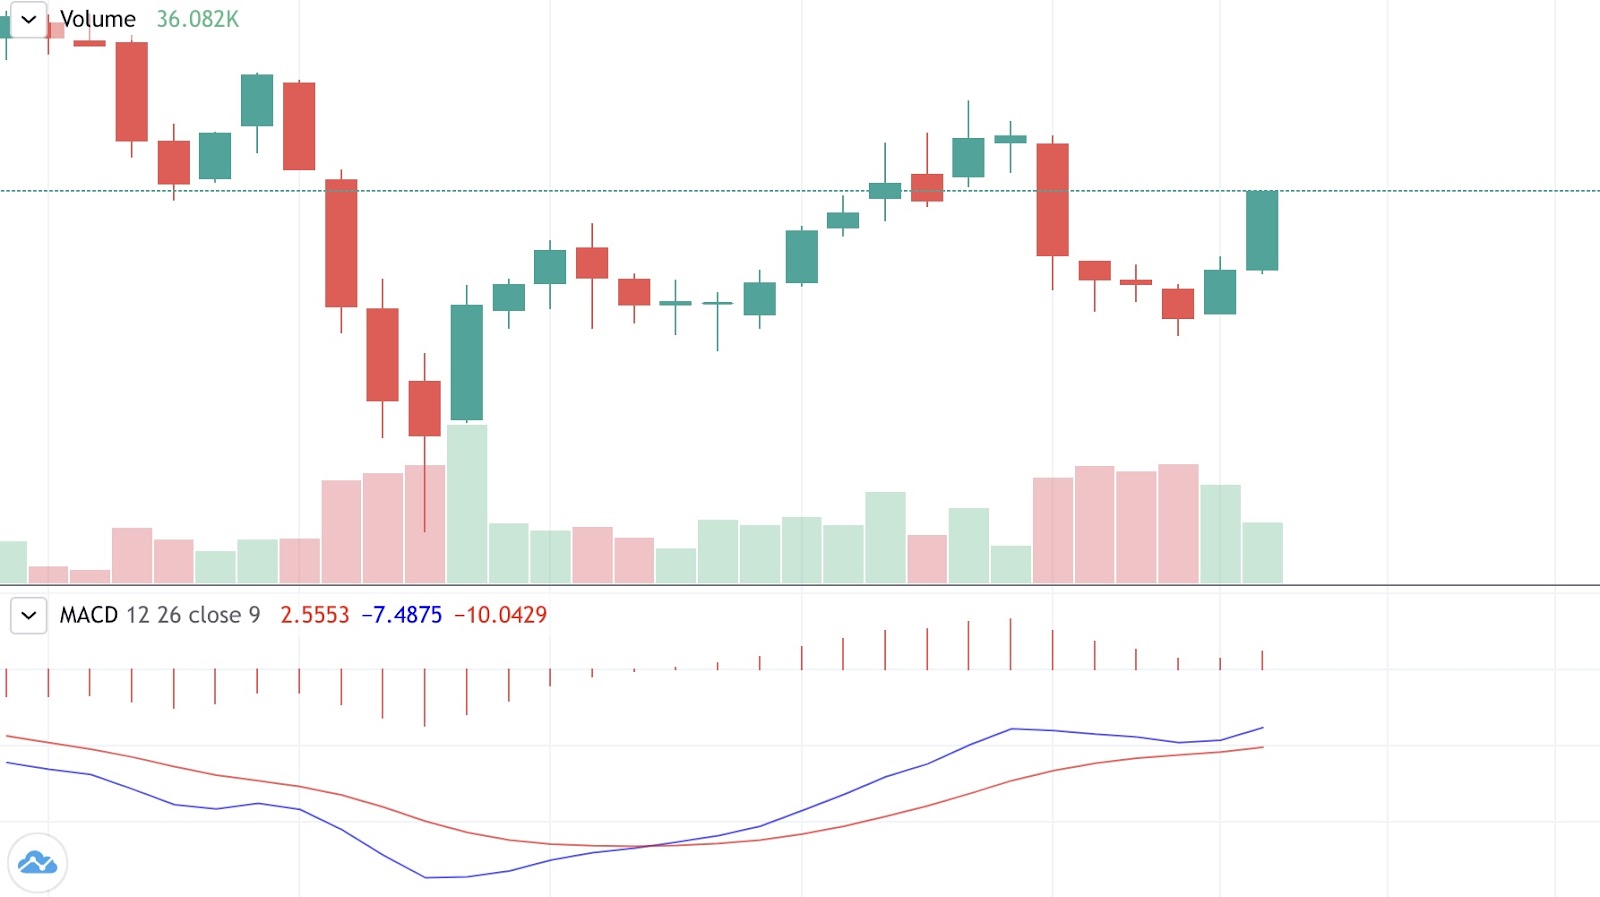
Check out the chart above for context.
If the MACD line reacts first and crosses over the zero line, it indicates a new trend has occurred. When the faster line (MACD) crosses below the zero line, it signals a downtrend. Conversely, when the MACD line crosses above the zero line, it signals an uptrend.
In addition, the MACD also signals to buy or sell trends. These are given when two MACD lines cross each other. When the MACD line crosses below the signal line, it is a sign to buy. On the other hand, an indication to sell is when the MACD line crosses above the signal line.
Related Articles
Triple Exponential Average
It is a momentum indicator that shows traders the percentage change in the moving average that has been smoothened exponentially three times. The TRIX is a powerful indicator that helps traders to identify the overbought and oversold conditions in an ...Volume Moving Average
What is Volume Moving Average (VMA)? Volume Moving Average is very similar to a simple moving average. But it is determined using volume data rather than price data. Volume moving averages help you to understand the general trends and volume patterns ...Weighted Moving Average
Weighted Moving Average (WMA) is one of the most popular indicators. This is due to the simple formula and its ability to measure market momentum. Weighted Moving Average is more descriptive and ultimately more detailed and follows the price more ...Triangular Moving Average
The Triangular Moving Average is a technical indicator similar to other moving averages. It is a simple MA that has been averaged again, creating an extra smooth moving average line. This indicator shows the average price of an asset over a specified ...Moving Average (MA)
A moving average is a stock indicator that traders use to identify a stock’s trend direction. Besides that, it also helps determine the resistance and support levels of financial security. A declining MA indicates a downtrend. Conversely, a rising MA ...