Money Flow Index
Overview – The Money Flow Index is an indicator that computes the flow of money into and out of security during a specific period. It is measured by positive and negative Money Flow Values which creates a money ratio. The Money Ratio is later on converted into oscillator form.
In This Article
What is the Money Flow Index?
How to analyze a chart using the Money Flow Index?
How to use Money Flow Index on Keev?
Category – Momentum/Volume
Type – Leading
What is the Money Flow Index?
The money Flow Index (MFI) is a volume as well as momentum indicator which assists in measuring the trading pressure on a selected asset like stocks. This is done by analyzing the price and volume of trading. MFI represents an oscillator which ranges between 0 and 100. It indicates if the stock is in the overbuying or overselling zone. In addition to this, the divergences between the prices and the indicator help to forecast the reversal in market trends.
Calculation of Money flow index
Firstly we need to calculate the period’s Typical Price = (High + Low + Close )/3
After this, we need to calculate Money Flow by multiplying the period’s Typical Price by the volume.
Money Flow = Typical Price × Volume
If today’s Typical Price is greater than yesterday’s Typical Price then it is regarded as Positive Money Flow. Whereas if today’s price is less it is considered as Negative Money Flow.
Positive Money Flow is the sum of the Positive money over the defined period. Whereas the Negative Money Flow is the sum of the Negative Money over the defined period.
The Money Ratio is then calculated by dividing the Positive Money Flow by the Negative Money Flow. Thus Money Ratio = Positive Money Flow/ Negative Money Flow.
Finally, the Money Flow Index is calculated using the Money Ratio.
Money Flow Index = 100 – [100/ (1+ Money Ratio)]
How to analyze a chart using Money Flow Index
MFI is also termed a volume-weighted version of RSI. This is because it is interpreted very similarly to RSI Oscillator. But the main difference lies in MFI regarding volume. The volume feature makes MFI work differently than RSI. By calculating the indexed value which depends on the number of bars, a line is plotted on the chart which oscillates between 0 and 100 levels.
MFI goes up with the increase in stock price which indicates an increase in buying pressure. Whereas MFI goes down when there is a decrease in stock price then it indicates a decrease in buying pressure. So you can understand that it’s possible to predict the directional movement of the market by constantly observing MFI.
Let’s understand this with the following chart
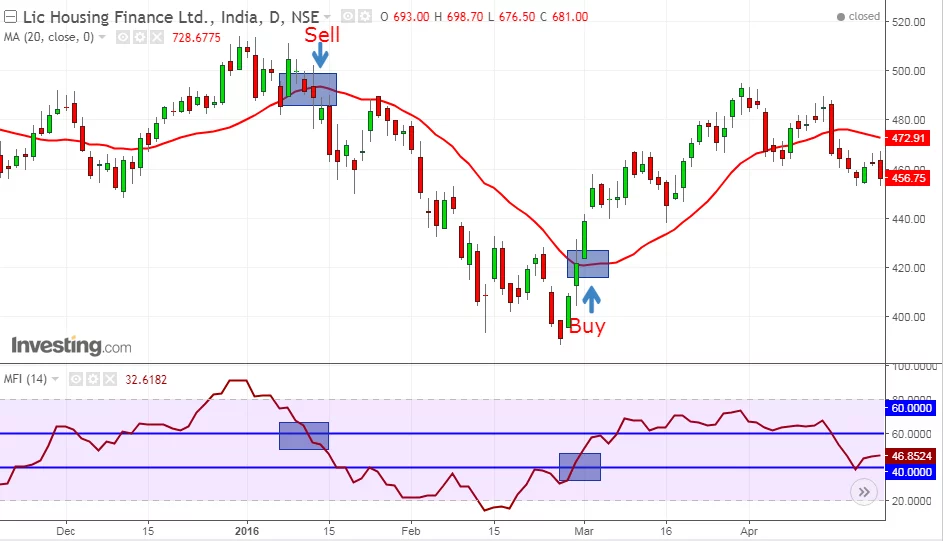
Image Source: - https://www.elearnmarkets.com/blog/wp-content/uploads/2017/08/Strategy-using-MFI.png
When the price cuts above 20 SMA from below and at the same time MFI also cuts above the 40 line, it indicates a buy signal.
In the same manner, when the price cuts below 20 SMA from above and at the same time MFI also cuts below the 60 line, then it indicates a sell signal.
Related Articles
Chaikin Money Flow (CMF)
Chaikin Money Flow (CMF) is an indicator that measures the buying and selling pressure by evaluating volume over a period. Technical analysts use this indicator to confirm trends and estimate the strength of a trend. KEEV makes it easier for you to ...Commodity Channel Index (CCI)
Commodity Channel Index is a momentum indicator that indicates the upcoming overbought or oversold situation. This index is derived from the cyclical movements of commodities or assets. Technical analysts use this indicator to identify the buy or ...#GetSmartWithKEEV Newsletter Vol 2: Insights on Index for the upcoming week
"The best time to buy is when there's blood in the streets." - Baron Rothschild Index Insights: KEEV Key highlights of the week: The markets after a consolidation phase is seeing a strong bull run. Equity mutual funds' inflow drops 76% to Rs 2,258 ...Relative Strength Index (RSI)
RSI is a momentum indicator measuring the change in the magnitude of a security’s price with time. It is expressed as a line graph on a scale of 0 to 100. While 0 is associated with an extremely bearish trend, 100 denotes a highly bullish trend. A ...Average Directional Index (ADX)
When you are trading in the direction of a strong trend, it reduces the risk and increases the chances of profit. The average directional index (ADX) helps us to understand when the price is trending strongly. At times it's considered to be the ...