Momentum Indicator
Introduction
Momentum indicators are a popular tool for technical analysis. Traders use it to understand the rate of price fluctuation of a stock. An individual can understand the strength of price movements from these indicators. The fall of the stock prices may be slow at times and may be fast at times. By using the momentum indicators we can analyze the speed of the fall or rise in particular stocks. From the research, it has been derived that the momentum indicators work well when the market is on the rise.
What are Momentum Indicators?
Momentum indicators help in analyzing the rate of speed at which the stock price falls or rises. The formula of these indicators compares the latest closing price with the previous closing price of the defined time frame. Majorly you will find the momentum indicator is represented as a single line below the price chart than the price line or bars.
How to trade with Momentum Indicators?
Let’s understand how traders can trade with the help of Momentum Indicators:-
Crossovers
Momentum indicators on crossing the middle line or other lines can generate trade signals. Take for example while using the Moving Average Convergence Divergence (MACD) a buying line is generated when the MACD line crosses the signal line from above or below.
Concept of Divergence
A bullish divergence occurs in a case where the price moves lower but the momentum indicator moves higher. It is the indication that with a fall in price, the momentum behind the selling is slowing and the trend may reverse to an uptrend.
A bearish divergence occurs in the case where the price moves higher but the momentum indicator moves lower.
We can interpret from this that with the price rise, the momentum behind the slowing trend may reverse the downside.
Popular Momentum Indicators
There are so many momentum indicators that you can utilize. But there are very few of them that are widely used.
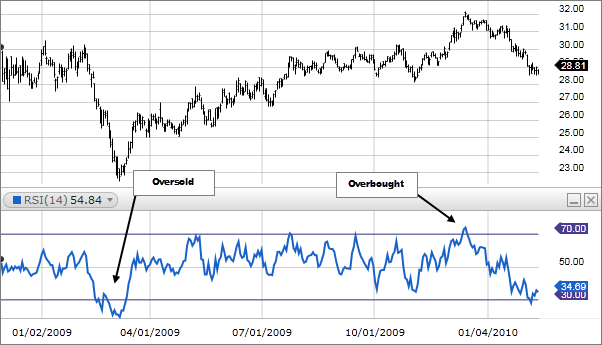
Relative Strength Index (RSI)

Image Source:- https://www.fidelity.com/bin-public/060_www_fidelity_com/images/LC/RSI1_602x345.png
The Relative Strength Indicator (RSI) is a very widely used momentum indicator. Here the average number of higher closes for a specific period is divided by the average number of lower closes. This then creates an oscillator of 0 to 100, where overbought and sold levels are at 70% and 30% respectively.
Average Directional Index (ADX)

Image Source:- https://miro.medium.com/max/498/1*I71MlKfHySzlVuaAkxbAjg.png
Moving Average Convergence Divergence (MACD)

Image Source:- https://www.forex.academy/wp-content/uploads/2021/02/macd-indicator-1068x637-1.png
It is regarded as the best momentum indicator. MACD is a momentum indicator that presents the relationship between the two moving averages i.e. 26 EMA and 12 EMA.
It is made up of the MACD line and the signal line. The MACD line is the difference between the 26 EMA and 12 EMA and the signal line is 9 EMA.
When the MACD line crosses the signal line from below it generates the buying signal. And when the MACD line crosses the signal line from above then the selling signal is generated.
Conclusion
Momentum indicators are an important tool for traders. It is majorly used with technical indicators which determine the direction of a trend.
Related Articles
Vortex Indicator
It is a technical indicator for identifying new or existing trends in the market. Introduced by Swiss market technicians Etienne Botes and Douglas Siepman, the Vortex indicator uses historical price data to predict trends in stock and commodity ...Fast Stochastic Indicator
Fast Stochastic is a technical indicator that measures the moments of the prices in the market. Technical analysts use this to identify overbought and oversold situations through their price moments. By using KEEV, you can analyse the Fast Stochastic ...Aroon Indicator
Developed by Tushar Chande, the Aroon indicator helps indicate if an asset is trending or is in a trading range. Besides that, this technical indicator reveals the beginning of a new trend and its strength. It moves between 0 and 100. Traders can ...Positive Directional Indicator
This indicator is a component of the Average Directional Index that traders use to measure the presence of an uptrend. PDI is nearly always plotted alongside the Negative Directional Indicator. When the PDI line slopes upward on the graph, it is a ...Negative Directional Indicator
NDI represents the downward behavior of a financial market. A part of the Average Directional Index (ADX), it is nearly always plotted alongside the Positive Directional Indicator. Designed by Welles Wilder for commodities, it aims to determine a ...