#GetSmartWithKEEV Newsletter Vol 1: Insights on Index for the upcoming week
|
|
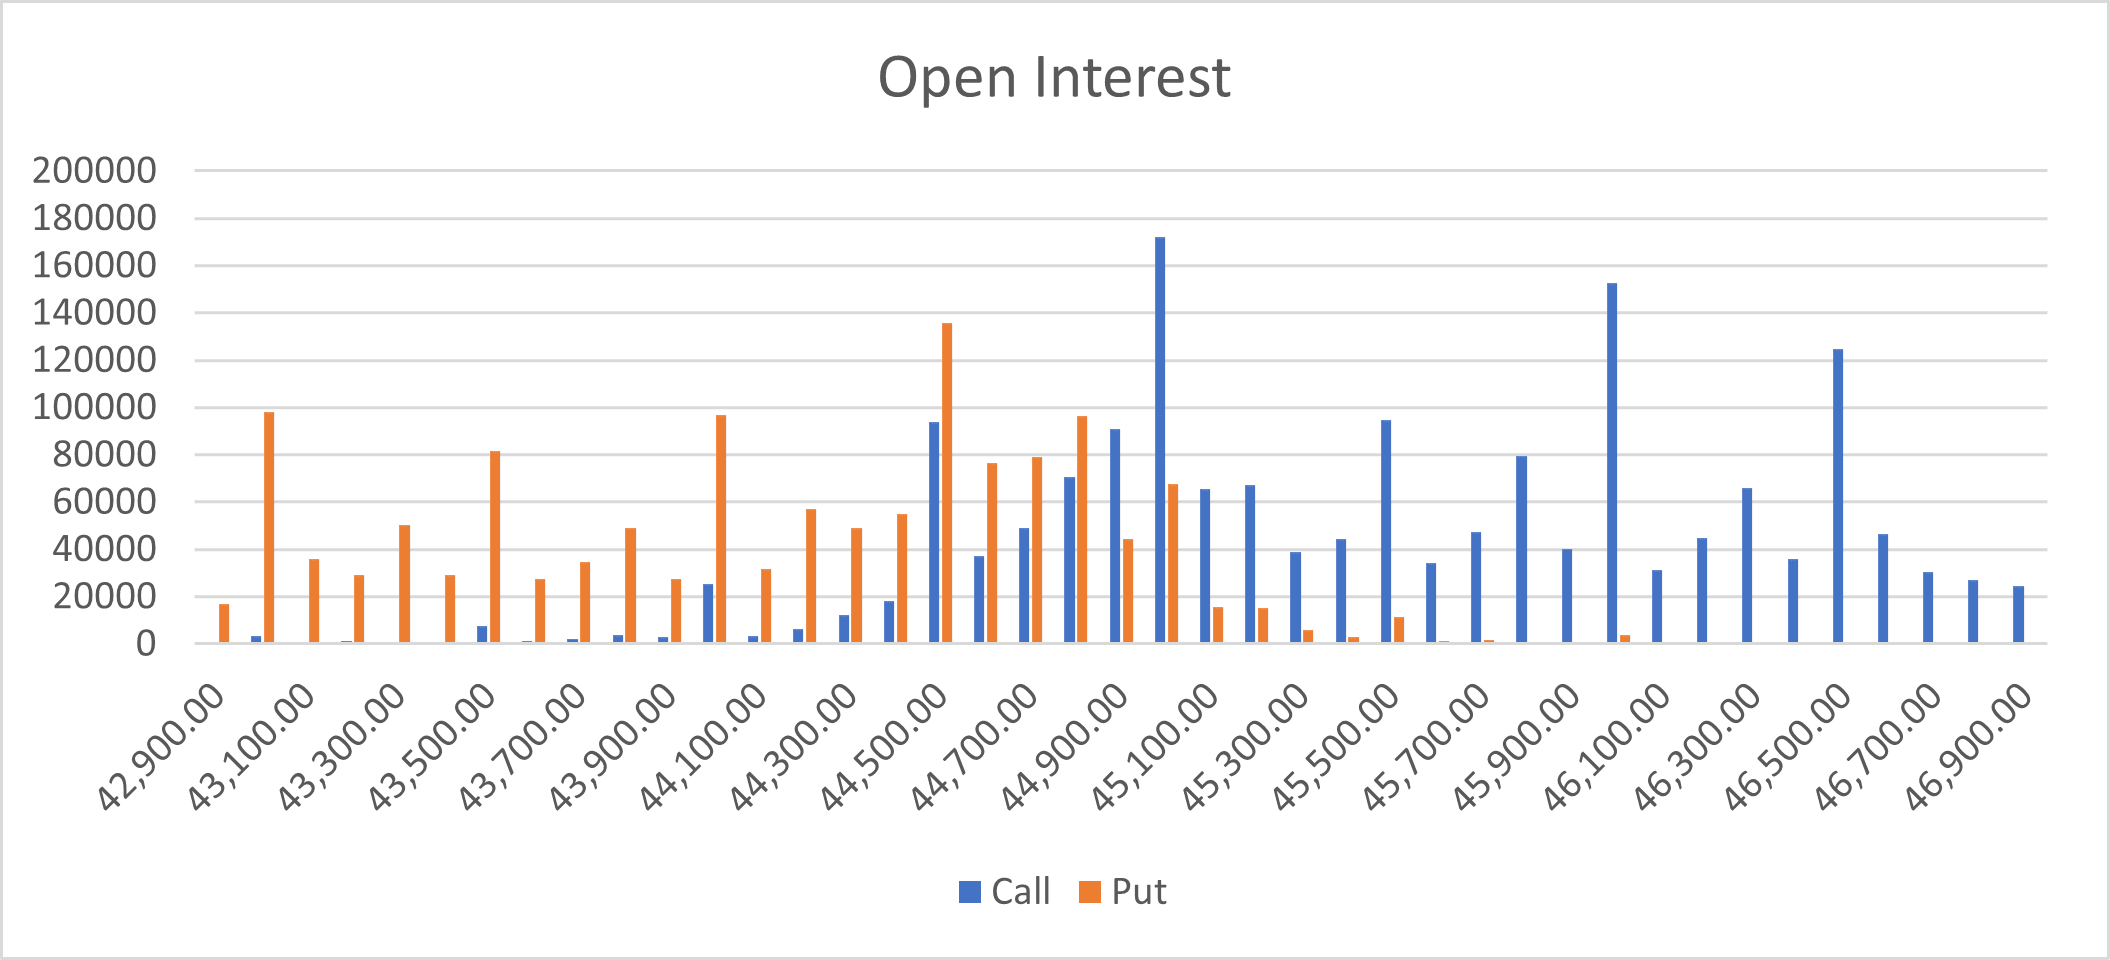
The chart above shows a good upward momentum from near 18800 levels then a consolidation around 19875 levels followed by a strong resistance breakout, the OI data given shows strong Put OI at 20000 levels, corresponding with the good upward momentum on chart, 20000 is also the highest Put OI, meaning the put option writers are not expecting Nifty to close below 20000 for this expiry at least. A clear chart trend is visible, showing a bullish sentiment on charts but the same is not supported by the OI data which shows a large range of 20000-21000 (Max Put OI and Call OI), which may be broken this expiry if the spot moves outside the range mentioned. The index has also confirmed an important breakout from near 19875, if maintained then can see a short reversal from these levels again.
It is important to note that the Call and Put sellers don't have a similar OI structure, the put sellers are more active, indicating a bullish expiry if these levels are breached.
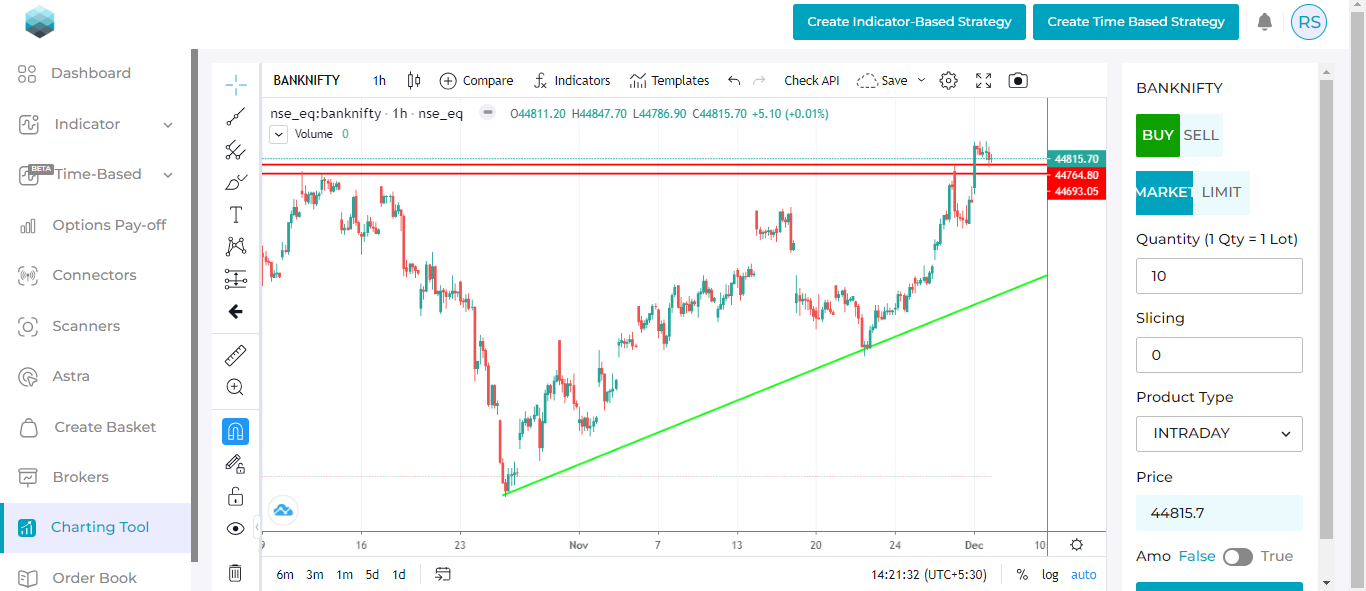
Banknifty Analysis
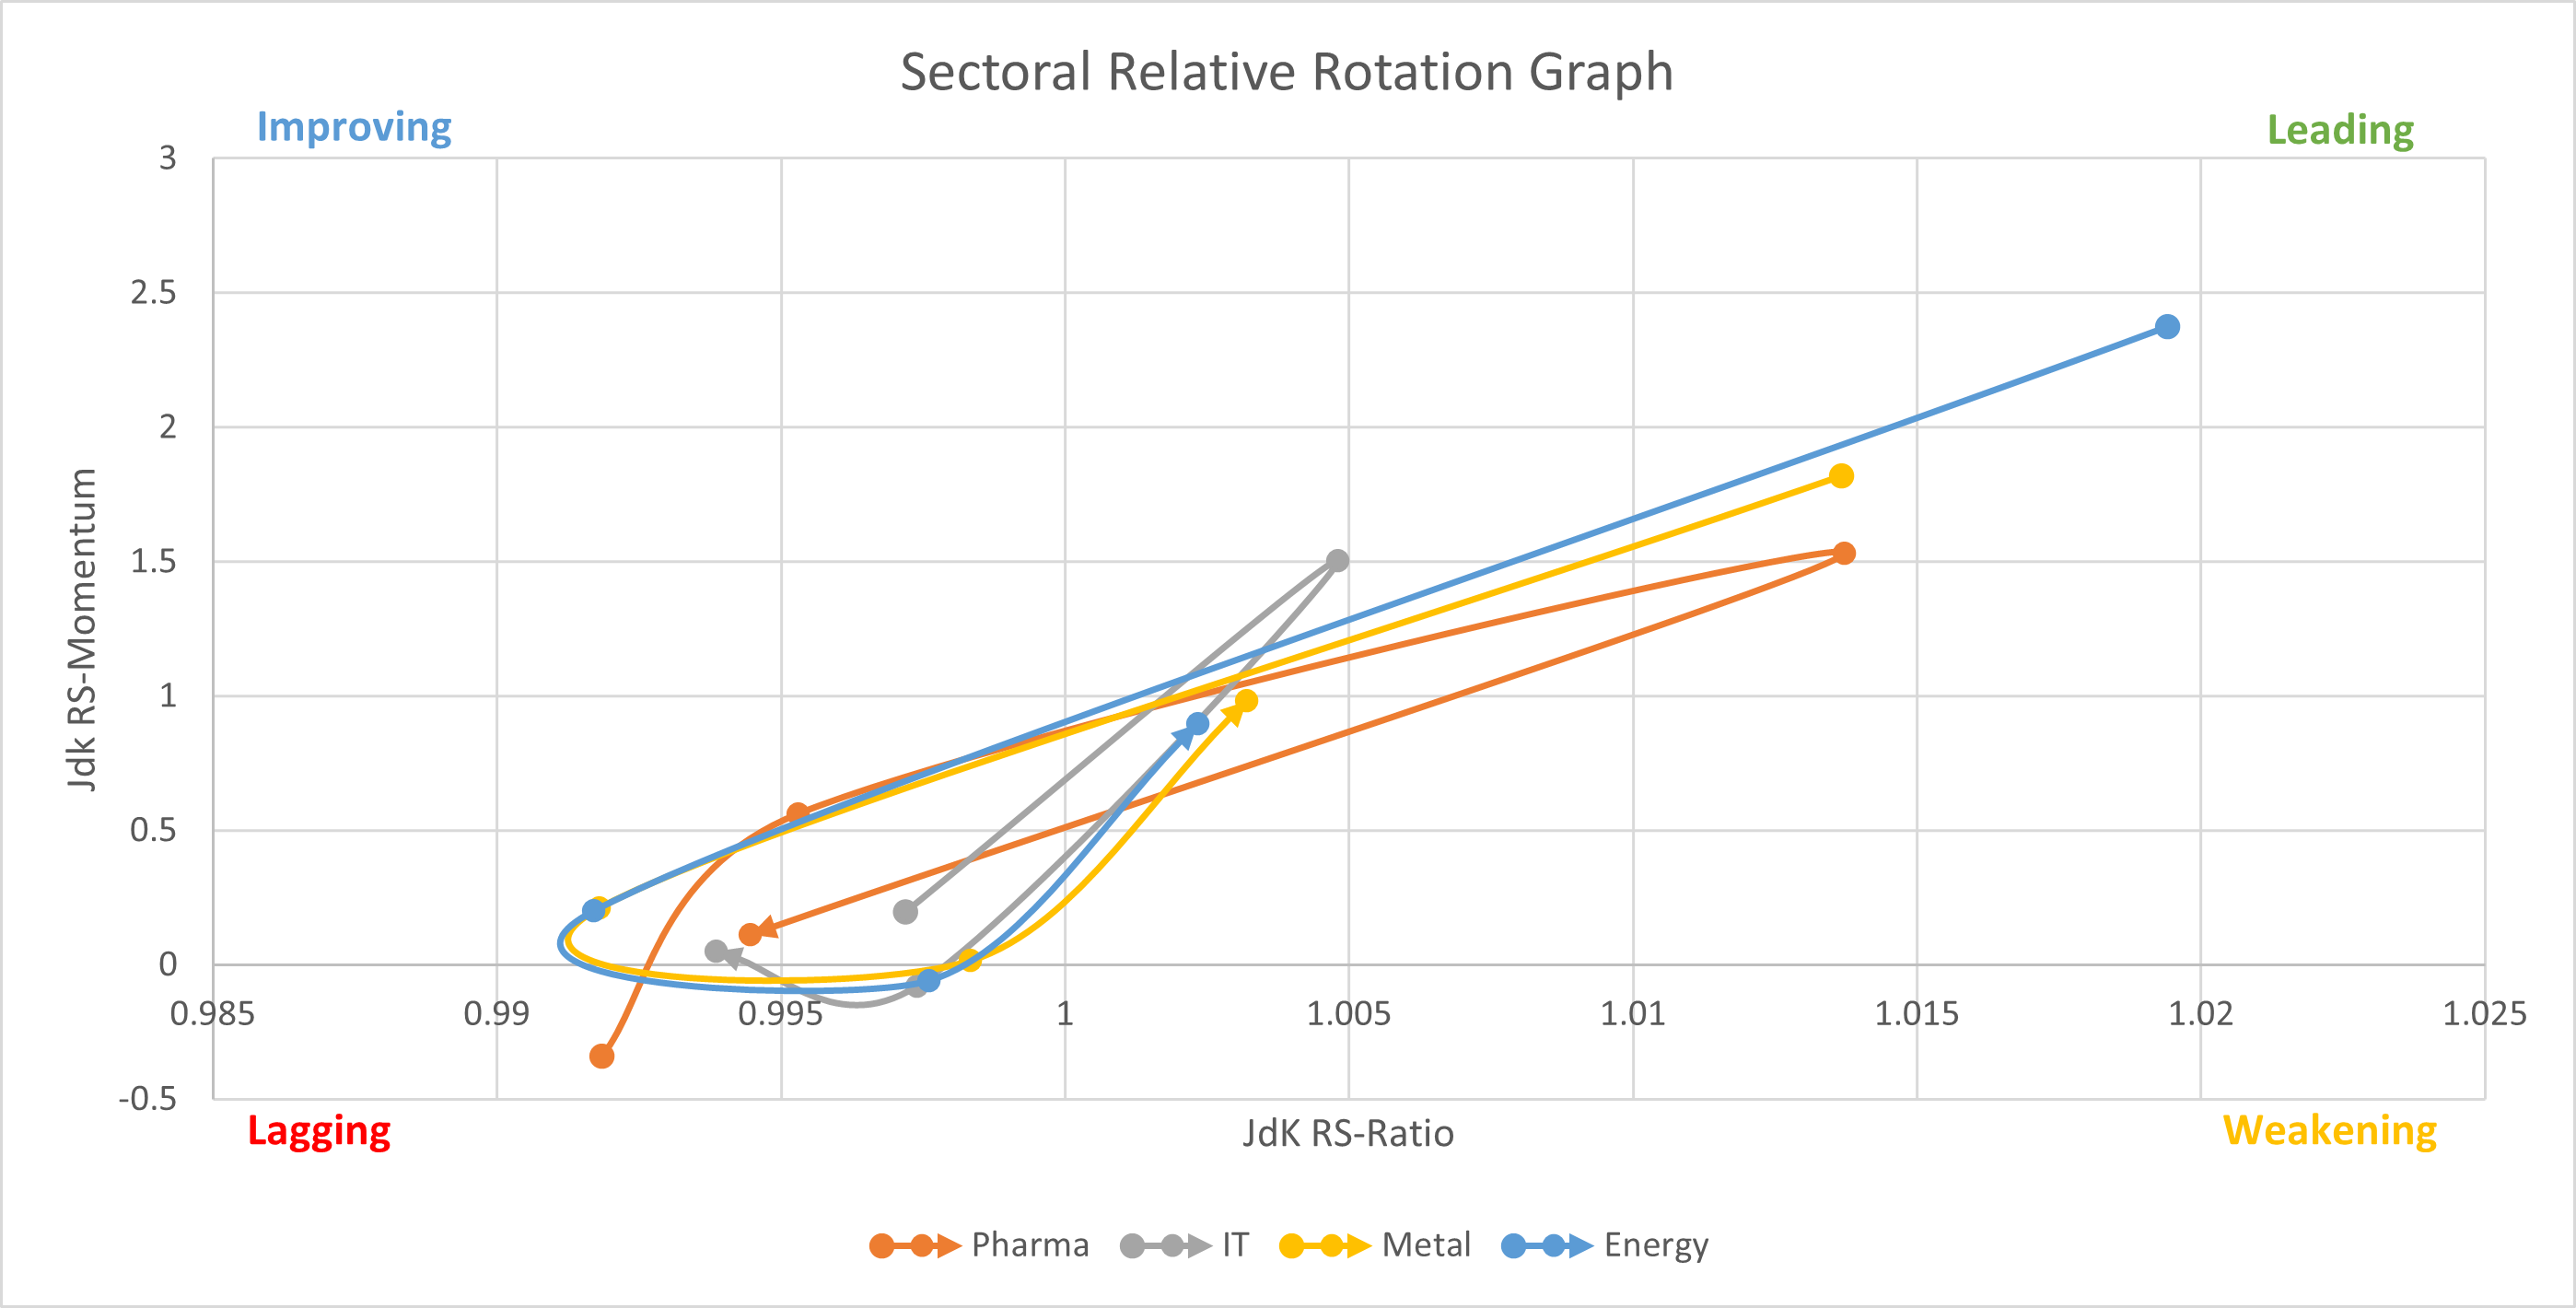
Sector Analysis
|
|
|
 Language : Hindi & English
 Date : Wednesday, 06th December 2023
 Time : 4:30 PM
Related Articles
#GetSmartWithKEEV Newsletter Vol 2: Insights on Index for the upcoming week
"The best time to buy is when there's blood in the streets." - Baron Rothschild Index Insights: KEEV Key highlights of the week: The markets after a consolidation phase is seeing a strong bull run. Equity mutual funds' inflow drops 76% to Rs 2,258 ...#GetSmartWithKEEV Newsletter Vol 3: Insights on Index for the upcoming week
"The best time to buy is when there's blood in the streets." - Baron Rothschild Index Insights: KEEV Key highlights of the week: The markets after a consolidation phase is seeing a strong bull run. Equity mutual funds' inflow drops 76% to Rs 2,258 ...Commodity Channel Index (CCI)
Commodity Channel Index is a momentum indicator that indicates the upcoming overbought or oversold situation. This index is derived from the cyclical movements of commodities or assets. Technical analysts use this indicator to identify the buy or ...Money Flow Index
Overview – The Money Flow Index is an indicator that computes the flow of money into and out of security during a specific period. It is measured by positive and negative Money Flow Values which creates a money ratio. The Money Ratio is later on ...Relative Strength Index (RSI)
RSI is a momentum indicator measuring the change in the magnitude of a security’s price with time. It is expressed as a line graph on a scale of 0 to 100. While 0 is associated with an extremely bearish trend, 100 denotes a highly bullish trend. A ...