Evening Star
An Evening Star pattern is a candlestick pattern which appears at the end of the uptrend and it indicates that a downtrend is about to occur. As it is an indicator of a downtrend, it appears as a red flag to traders and indicates that it’s time to book profits.
In This Article
· What is Evening Star?
· How to analyse chart using Evening Star?
· How to use Evening Star on Keev?
Category Trend
Type Leading
What is Evening Star?
An Evening Star is a bearish candlestick pattern made of three candles i.e large white candlestick, a small-bodied candle, and a red candle. It signals that the uptrend is about to end.
Its pattern is formed for three days.
The first day is of a large white candle which signifies a continuous rise in prices.
On the second day which is a smaller candle shows a more modest price increase.
On the third day, which shows a large red candle, opens at a price below the previous day and closes near the middle of the first day.
How to analyse chart using Evening Star?
Let's understand how to analyse a chart using an Evening Star. Here is a chart of Exxon Mobil (XOM) that shows an example of an Evening Star.
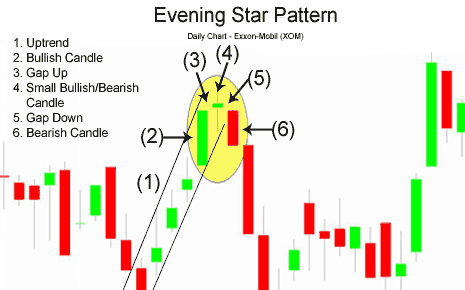
Day 1:- It reflects a strong bullish candle. The close was the same as the high.
Day 2:- It continues Day 1’s bullish trend by gapping up. But Day 2 is a Doji i.e candlestick indicating indecision. The bulls couldn’t continue the large rally of the previous day. They could close slightly higher than the open price.
Day 3:- It began with a bearish gap down. Exxon Mobil stock was bearish for the entire day. The open was the same as high and the close was the same as low. This is a clear sign of bearish sentiment.
Day 3 fell below the upward trendline. Both the trendline broke and the classic Evening Star pattern occurs giving traders an indication to sell short.
Related Articles
Morning Star
The Morning Star candlestick is a triple candlestick pattern which indicates a bullish reversal. It's formed at the bottom of the downtrend and gives us an indication that the ongoing downtrend is going to reverse. A Morning Star is a visual ...Doji-Star
Doji-star is an indicator that predicts the upcoming reversal of the current trend at a certain point in time. The traders and investors look at it as a point of indecision and a reversal trend. It can determine the trend directions. KEEV makes the ...Tri-Star Pattern
The Tri-Star pattern is a quite accurate pattern. It’s hardly used by traders. If the tri-star pattern is used in combination with other indicators or oscillators then a trader can expect a good trade. The bullish tri-star indicates the end of the ...Abandoned Baby
The abandoned baby pattern is a multiple candlestick reversal pattern. A bullish abandoned baby pattern indicates the end of the selling pressure of the bears and the return of bulls in the market. Whereas a bearish abandoned baby is the sign that ...