Engulfing
Engulfing is one of the most reliable technical chart indicators that signal the reversal of the ongoing trend. Investors and traders also use this indicator as an exit strategy. KEEV helps you to make optimum utilization of this indicator very smoothly.
In This Article
You will understand the following mentioned below.
What is Engulfing?
How To Analyze the Chart Using Engulfing?
How To Use Engulfing on KEEV?
Category
Trend
Type
Lagging
What is Engulfing?
Engulfing is a duo-candle pattern, where the first candle body is engulfed by the second candle body. The engulfing pattern is a reversal candlestick pattern that appears either at the end of an upward or downward trend. It is widely used as a technical indicator to identify the trend reversal point.
You can use these benchmarks to identify the Engulfing with ease.
When there is a combination of bearish [red] and bullish [green] candles.
When the first candle is captivated by the second one.
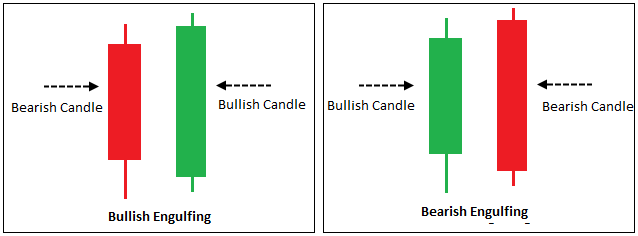
In the above chart, there are two candles namely bearish and bullish.You can notice that there is a small candle in the beginning, followed by a larger candle whose body completely surrounds the previous candle. This is exactly an indication of a engulfing pattern.
There are two different types of engulfing pattern:
The bearish engulfing pattern
The bullish engulfing pattern
When you spot an engulfing pattern on the chart you have three options:
You can anticipate reversals of trends and enter the market accordingly.
You can consider it as a signal for continuation of the current trend in the market.
If you hold a buying or a selling position in the ongoing trend of the market, you can consider this as an exit point identifier.
When engulfing patterns are confirmed, you can place trades.
Related Articles
Stick Sandwich
A stick sandwich trading pattern is a candlestick formation that takes place in both bearish and bullish indications and signals a reversion of a trend. Depending on the pattern that can be bullish and bearish, it looks different. At times this ...